
UK driver eyesight statistics
What collision records, roadside checks and driver surveys tell us about vision and road safety.
On this page
Latest figures and updates
Evidence last checked:
View sources and methodsWhich figures are the latest?
- Official collision records: final 2025 figures, from the DfT tables released in September 2026. Direct and converted reporting systems are shown separately. [1]
- Roadside eyesight checks: the October–November 2025 campaign, published in the 2026 research report. [2]
- Surveys: driver experiences from August 2026 and public views on eyesight testing from November 2025. Each chart identifies its own period and population. [3] [6]
Why do some figures use older years?
Official statistics are published after data has been collected and checked. Surveys and roadside reports follow different schedules. A guide checked in 2026 can therefore use 2025 evidence as the latest available for that measure. The 2024 collision figure is included only to explain an older headline, not as the latest annual total.
How is this guide updated?
For each update, we check new source releases and relevant changes to official guidance. We verify definitions and calculations, refresh the affected charts, tables and CSV/JSON downloads together, then record the new evidence-check date. New DfT tables, a new roadside report or changed eyesight rules prompt a review; the date is not advanced automatically.
Driver eyesight: the key statistics
How common is poor eyesight among drivers, and how much harm is recorded on the road? The answer depends on what is being measured. A roadside number-plate check, a survey answer and a police collision record each provide a different part of the picture.
Injury collisions
Eyesight was recorded as a factor in the direct road-safety-factor dataset. [1]
Great Britain · 2025 · partial reporting coverageFailed a roadside check
59 failures among 3,778 tests during the police eyesight campaign. [2]
32 police forces · 2025 · campaign sampleDid not identify 20 metres
Answered the number-plate distance question incorrectly in a driver survey. [3]
2,000 UK drivers · August 2026 · self-report surveyThe 424 collisions are from one reporting system. A separate converted dataset records 69. The roadside sample is not a random sample of all licence holders, and survey answers do not diagnose a driver’s eyesight.
British collision figures cover England, Scotland and Wales. UK surveys can also include Northern Ireland. Figures on this page retain the geography and reporting period of their original source.
How many collisions involve defective eyesight?
The Department for Transport’s final 2025 tables record 424 injury collisions with uncorrected or defective eyesight assigned as a factor in records collected directly under the newer road safety factor system. Those collisions involved 581 casualties, including 18 people killed and 186 killed or seriously injured after adjustment. The people harmed can include passengers and other road users, as well as the driver whose eyesight was recorded. [1]
A second table converts records collected under the older contributory-factor system to the newer categories. It contains 69 eyesight-factor collisions and 84 casualties, including four deaths and 30 adjusted killed-or-seriously-injured casualties. These are separate reporting groups, not two competing estimates of the same total.
Recorded harm where eyesight was a factor
Great Britain · 2025 · Direct road safety factors · number of collisions
Eyesight recorded as a factor. The categories are nested: fatal is included in fatal/serious, and both are included in the total. Do not add the bars. Each reporting system is kept separate. [1]
Read all chart values as a table
| View | Measure | Value | Base / coverage |
|---|---|---|---|
| Direct road safety factors — collisions | All injury collisions | 424 | Direct road safety factors; partial factor-data coverage |
| Direct road safety factors — collisions | Fatal or serious collisions (adjusted) | 161 | Direct road safety factors; partial factor-data coverage |
| Direct road safety factors — collisions | Fatal collisions | 16 | Direct road safety factors; partial factor-data coverage |
| Direct road safety factors — casualties | All casualties | 581 | Direct road safety factors; partial factor-data coverage |
| Direct road safety factors — casualties | Killed or seriously injured (adjusted) | 186 | Direct road safety factors; partial factor-data coverage |
| Direct road safety factors — casualties | People killed | 18 | Direct road safety factors; partial factor-data coverage |
| Converted contributory factors — collisions | All injury collisions | 69 | Converted contributory factors; partial factor-data coverage |
| Converted contributory factors — collisions | Fatal or serious collisions (adjusted) | 28 | Converted contributory factors; partial factor-data coverage |
| Converted contributory factors — collisions | Fatal collisions | 4 | Converted contributory factors; partial factor-data coverage |
| Converted contributory factors — casualties | All casualties | 84 | Converted contributory factors; partial factor-data coverage |
| Converted contributory factors — casualties | Killed or seriously injured (adjusted) | 30 | Converted contributory factors; partial factor-data coverage |
| Converted contributory factors — casualties | People killed | 4 | Converted contributory factors; partial factor-data coverage |
Why the page keeps the two recording systems separate
Police forces began moving to the new system in late 2023. The questions, categories and recording practices changed. DfT publishes a split table so users can distinguish directly recorded road safety factors from older records converted to those categories. Adding them and comparing the result with an older headline can make a recording change look like a change in road safety.
Factor information is also incomplete. It is associated with a subset of police-reported injury collisions, rather than every crash. Damage-only incidents, unreported injuries and cases without suitable factor information are outside this analysis. Officers record factors they judge may have contributed; the entries do not establish a sole cause. [4]
No. They show eyesight recorded as a factor within specified police datasets. They cannot count every eyesight-related collision or establish the percentage of all drivers with unsafe vision.
What about the frequently quoted 274 collisions?
A DfT parliamentary answer gives 274 injury collisions in Great Britain in 2024 with uncorrected or defective eyesight assigned as a factor. That is a valid figure for the year and definition in the answer. It should not be treated as directly comparable with a single 2025 reporting group or used to calculate an unqualified annual increase. [5]
For the wider road-safety picture, see our road traffic accident statistics. That guide covers the overall casualty picture, while this page concentrates on the evidence about vision.
What roadside eyesight checks found
During the 2025 police eyesight campaign, 32 forces in England, Scotland and Wales recorded 3,778 number-plate checks. There were 3,719 passes and 59 failures, giving an overall failure proportion of 1.6% when rounded to one decimal place. A pass means the driver read the plate in that check; it is not a complete examination of visual acuity, visual fields or eye health. [2]
Results of the 2025 roadside checks
Great Britain · 2025 campaign · share of 3,778 tests
Selected roadside sample. A pass is a successful number-plate check, not a full assessment of vision. [2]
Read all chart values as a table
| View | Measure | Value | Base / coverage |
|---|---|---|---|
| Percentage | Passed | 98.4% | 3,719 of 3,778 tests |
| Percentage | Failed | 1.6% | 59 of 3,778 tests |
| Number of tests | Passed | 3719 | 3,778 tests |
| Number of tests | Failed | 59 | 3,778 tests |
Who was tested?
Campaign checks were carried out when police had an opportunity to test drivers. The sample included volunteers and people encountered through policing activity. It was not drawn randomly from the national licence-holder population. The mixture of people, forces, ages and reasons for being tested affects the result.
That matters when interpreting headlines. Multiplying a campaign failure percentage by the number of licence holders assumes the tested drivers represent all drivers. This page does not make that assumption. Nor can a comparison between campaign years establish a national trend if the mix of participating forces and drivers changes.
How recently had drivers had an eye test?
In the campaign sample, 111 of 255 drivers under 25 reported an eye test within two years (43.5%), compared with 474 of 531 drivers over 70 (89.3%). The bars use the full age-group base, including missing answers. Switch the view to see reported non-attendance and unanswered cases.
Recent eye tests by age in the roadside sample
Great Britain · 2025 campaign · eye test in past two years
Self-reported. Each age-group base includes unanswered cases. Three drivers with no recorded age are excluded from the age bars. Groups describe the tested sample, not national prevalence. [2]
Read all chart values as a table
| View | Measure | Value | Base / coverage |
|---|---|---|---|
| Eye test in past two years | Under 25 | 43.5% | 111 of 255 in age group |
| Eye test in past two years | 25 to 40 | 51.3% | 540 of 1,053 in age group |
| Eye test in past two years | 41 to 60 | 67.4% | 904 of 1,342 in age group |
| Eye test in past two years | 61 to 70 | 77.9% | 463 of 594 in age group |
| Eye test in past two years | Over 70 | 89.3% | 474 of 531 in age group |
| No eye test in past two years | Under 25 | 51.8% | 132 of 255 in age group |
| No eye test in past two years | 25 to 40 | 46.1% | 485 of 1,053 in age group |
| No eye test in past two years | 41 to 60 | 30.5% | 409 of 1,342 in age group |
| No eye test in past two years | 61 to 70 | 19.0% | 113 of 594 in age group |
| No eye test in past two years | Over 70 | 9.4% | 50 of 531 in age group |
| Answer not recorded | Under 25 | 4.7% | 12 of 255 in age group |
| Answer not recorded | 25 to 40 | 2.7% | 28 of 1,053 in age group |
| Answer not recorded | 41 to 60 | 2.2% | 29 of 1,342 in age group |
| Answer not recorded | 61 to 70 | 3.0% | 18 of 594 in age group |
| Answer not recorded | Over 70 | 1.3% | 7 of 531 in age group |
These results describe eye-test attendance, not the percentage meeting the driving standard. They do not show that an age group is safer or that eye-test attendance caused a particular outcome.
Were drivers using their prescribed correction?
Of the 1,248 drivers who reported being prescribed glasses or contact lenses for driving, 52 were not wearing them when checked. Eight answers were unrecorded. Keeping that subgroup denominator visible avoids treating the result as a percentage of everyone tested.
Were prescribed lenses being worn?
Great Britain · 2025 campaign · 1,248 drivers prescribed corrective lenses
The denominator is drivers who reported a prescription for driving, not all 3,778 tested drivers. Missing answers are retained. [2]
Read all chart values as a table
| View | Measure | Value | Base / coverage |
|---|---|---|---|
| Percentage | Wearing prescribed lenses | 95.2% | 1,188 of 1,248 prescribed correction |
| Percentage | Not wearing prescribed lenses | 4.2% | 52 of 1,248 prescribed correction |
| Percentage | Answer not recorded | 0.6% | 8 of 1,248 prescribed correction |
| Number of drivers | Wearing prescribed lenses | 1188 | 1,248 drivers prescribed correction |
| Number of drivers | Not wearing prescribed lenses | 52 | 1,248 drivers prescribed correction |
| Number of drivers | Answer not recorded | 8 | 1,248 drivers prescribed correction |
Drivers of any age need to meet the applicable standard. Older-driver policy debates and younger-driver road risk are separate questions; neither tells an individual whether their own eyesight is adequate. Our young driver statistics explain the broader difference between age, exposure and casualty risk.
What driver surveys tell us about vision
MoneySuperMarket surveyed 2,000 UK drivers aged 18 or over with regular access to a car, from 7–11 August 2026. Alongside the distance-awareness result above, respondents reported difficulty in the conditions shown below. These are their reported experiences, not clinical findings. [3]
Conditions drivers reported finding difficult
UK · August 2026 survey · percentage of 2,000 drivers
Multiple responses may overlap. Self-reported difficulty; not collision causation or measured visual impairment. [3]
Read all chart values as a table
| View | Measure | Value | Base / coverage |
|---|---|---|---|
| Highest first | Low sun or glare | 46% | 2,000 surveyed UK drivers |
| Highest first | Night driving | 45% | 2,000 surveyed UK drivers |
| Highest first | Fog or mist | 36% | 2,000 surveyed UK drivers |
| Highest first | Wet roads / headlight glare | 33% | 2,000 surveyed UK drivers |
| Highest first | Snow | 21% | 2,000 surveyed UK drivers |
What to do about glare and night-time visibility
The Highway Code advises drivers dazzled by bright sunlight to slow down and, if necessary, stop. It also says not to use tinted glasses, lenses or visors at night or in poor visibility if they restrict vision. If a journey for work cannot be completed safely, the plan needs to allow an alternative. [9]
Confidence and visual fitness are different
A driver can feel confident and still need corrective lenses or a professional assessment. Equally, reporting difficulty with low sun or oncoming headlights does not by itself mean someone fails a licensing standard. Surveys are useful for identifying questions worth discussing, while an eye examination addresses the individual’s vision.
The useful workplace response is to create a clear reporting route. Someone who notices a change should know who to tell, how to arrange appropriate advice and what happens to an essential journey if they cannot safely drive. A questionnaire should support that process rather than provide a pass or fail decision about fitness to drive.
Public support for eyesight testing
A separate survey commissioned by the Association of Optometrists and the College of Optometrists asked UK adults about requiring evidence of an eye test. It found support for checks at first licence application and at renewal, with responses also available for different proposed age thresholds. These are opinions about policy, not results from drivers’ eye examinations. [6]
Support for proposed eyesight checks
UK adults · November 2025 · percentage supporting each proposal
Policy opinions, not current law or eyesight measurements. Opinium surveyed 2,000 UK adults online, 25–27 November 2025. [6]
Read all chart values as a table
| View | Measure | Value | Base / coverage |
|---|---|---|---|
| Licence application and renewal | At first licence application | 71% | 2,000 adults overall; per-question base unpublished |
| Licence application and renewal | At every licence renewal | 68% | 2,000 adults overall; per-question base unpublished |
| Proposed driver age thresholds | Drivers aged 40+ | 51% | 2,000 adults overall; per-question base unpublished |
| Proposed driver age thresholds | Drivers aged 50+ | 59% | 2,000 adults overall; per-question base unpublished |
| Proposed driver age thresholds | Drivers aged 60+ | 70% | 2,000 adults overall; per-question base unpublished |
| Proposed driver age thresholds | Drivers aged 70+ | 76% | 2,000 adults overall; per-question base unpublished |
The age thresholds are alternative proposals put to respondents. They are not separate groups of drivers and should not be read as failure rates among people of those ages.
Proposals and current requirements
As checked on 16 November 2026, mandatory eyesight tests for older drivers remained a proposal in the official consultation material. The consultation had closed; it did not itself introduce a new requirement. Existing eyesight standards still apply whenever someone drives. [7] [8]
What is the eyesight standard for driving?
For cars and motorcycles in Great Britain, the standard includes more than reading a number plate. GOV.UK sets out three elements: the plate-reading requirement, a minimum visual-acuity standard and an adequate field of vision. Glasses or contact lenses can be used where permitted, and must be worn whenever they are needed to meet the standard. [7]
Cars and motorcycles
- Read a modern number plate from 20 metres.
- Visual acuity of at least 6/12 (0.5) using both eyes together, or the only functioning eye.
- Have an adequate field of vision.
- Use the glasses or lenses needed to meet the standard every time you drive.
Lorries and buses
- Higher acuity thresholds: at least 6/7.5 (0.8) in the better eye and 6/60 (0.1) in the other.
- More demanding visual-field requirements.
- Additional rules for corrective lenses and notifying relevant eye conditions.
- Check the full DVLA requirements for the licence category.
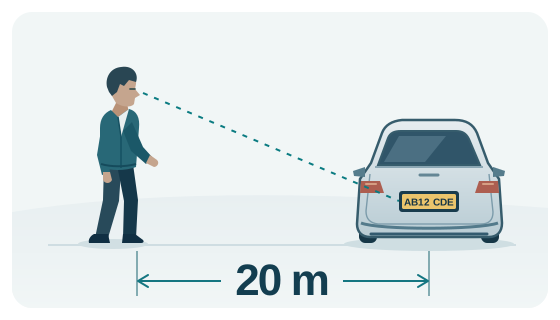
The Highway Code specifies good daylight and a 20.5-metre distance for the older number-plate format. A screen image cannot reproduce a legally specified plate at a measured outdoor distance. The diagram at the top of this page explains the distance; it is not an online eyesight test. [9]
What happens if you fail the check before a driving test?
The practical test starts with a number-plate check. If a candidate cannot meet the requirement, the test does not proceed. GOV.UK explains that DVLA is informed and the licence is revoked; reapplying involves a further eyesight check before another practical test. [7]
Eye conditions and changes in vision
If you are unsure whether you meet the standard, seek advice from an optometrist, doctor or eye specialist. Notification requirements depend on the condition and licence category. Use the official condition guidance rather than assuming that having glasses, having one functioning eye or having had eye surgery automatically answers the question. [10]
Northern Ireland uses the Driver & Vehicle Agency (DVA). Its number-plate rule also specifies 20 metres for the modern format and 20.5 metres for the older format. Follow Northern Ireland’s own reporting and licensing guidance where it applies. [11]
An eyesight checklist for driving for work
HSE advises employers to make sure workers are fit to drive and meet the eyesight and other health requirements of the Highway Code and DVLA. Driving for work can include using a company vehicle or an employee’s own vehicle for business. The risk assessment should consider the driver, journey and vehicle together. [12] [14]
Use the checklist as a discussion and planning aid. Ticking the boxes does not certify someone’s vision or replace a professional assessment. Your selections remain in this page and are cleared when it is reloaded.
0 of 7 planning points reviewed.
Make reporting useful
A policy is more practical when it describes what happens next. For example, a worker who reports new difficulty seeing on an evening journey needs a clear route to stop safely, contact the organisation and arrange appropriate advice. A manager should not ask the worker to continue simply because a delivery or visit is urgent.
Keep decisions proportionate to the role and the advice received. Record necessary work arrangements, avoid collecting unnecessary medical detail, and review controls when duties or health circumstances change. A routine licence check and a health discussion serve different purposes.
Online CPD Academy provides workplace safety learning. Our risk assessment training supports the process of identifying hazards, choosing controls and reviewing them. For vehicle movement within a workplace, see the separate workplace transport statistics guide.
Check your understanding
Three short questions about interpreting the evidence and applying the standards. This checks knowledge, not eyesight or fitness to drive.
Frequently asked questions
How many accidents are caused by poor eyesight in the UK?
There is no complete UK total established by the datasets on this page. DfT recorded eyesight as a factor in 424 injury collisions in its direct 2025 road-safety-factor records for Great Britain, and 69 in a separate converted dataset. Coverage and recording limits mean these should not be presented as a count of every crash caused by poor vision.
What percentage of drivers failed the 2025 police eyesight checks?
59 of 3,778 tests were failed, or 1.6% rounded to one decimal place. The campaign involved 32 forces in England, Scotland and Wales. This is a result for the tested sample, not a national prevalence estimate.
Is 20 metres the same as the full driving eyesight test?
No. The number-plate requirement is one element. The Great Britain standard for cars and motorcycles also specifies visual acuity of at least 6/12 and an adequate field of vision. An optician can assess aspects of vision that a plate-reading check does not measure.
How often should drivers have an eye test?
The NHS recommends an eye test every two years, or more often if advised by your optometrist. This is health guidance, not a universal statutory interval for driving tests. Do not wait for a routine appointment if your vision changes or you are unsure whether you meet the driving standard. [13]
Are glasses allowed for the number-plate check?
Yes. Glasses or contact lenses may be used to meet the car-driving standard. If you need them to meet that standard, you must wear them whenever you drive. Lorry and bus licensing has additional requirements.
Does difficulty driving at night mean I should report an eye condition?
Difficulty in a particular condition does not by itself identify a diagnosis or notification requirement. Get appropriate professional advice if your vision changes or you are unsure you meet the standard. Check the official guidance for your condition and licence category.
Do employers need to consider eyesight in a driving risk assessment?
Yes. HSE’s driving-for-work guidance says workers must satisfy eyesight and other health requirements. Employers should consider fitness to drive alongside the journey and vehicle, and make reporting concerns and arranging follow-up practical.
Are eyesight tests compulsory when drivers turn 70?
There is no general age-triggered eye-test requirement for renewing a Great Britain car licence in the guidance checked on 16 November 2026. Drivers renew at 70 and at most every three years, must meet the eyesight standards and must report relevant conditions. Mandatory testing was the subject of a 2026 consultation; a proposal is not itself a change in law. DVLA can require further assessment in individual medical cases. [8] [15]
Sources, downloads and methodology
Evidence checked: . This guide brings together published official records, a roadside campaign and independently commissioned surveys. Online CPD Academy has not conducted the surveys or examined the drivers. The chart data retains the original source, period, population and reporting limitations.
How the figures were prepared
- Collision data: the original DfT RAS0701 split workbook supplies the 2025 tables. Direct road safety factors and converted contributory factors remain separate. Collisions, casualties and adjusted injury counts are different measures; KSI includes fatalities.
- Roadside checks: we use the research report’s pass and fail counts. Percentages are calculated from the applicable tested sample and displayed with their base. Sample composition limits wider inference.
- Surveys: each survey is presented separately. Fieldwork dates, respondent groups and published measures are retained; chart labels paraphrase the releases. Full questionnaires are not available for every survey. Self-reported difficulty, awareness and policy opinions are not clinical diagnoses or collision-risk estimates.
- Charts: percentage axes start at zero. A selectable chart changes its label, unit and explanation with the view. Every chart has a readable table, and the CSV retains context alongside the number.
- Geography: Great Britain excludes Northern Ireland. UK survey findings and Northern Ireland licensing guidance are labelled separately.
- Department for Transport — RAS0701 split workbook, 2025
September 2026 release. Direct and converted factor records kept separate; severity counts are nested. Workbook retained for verification.
- Hawley — Is Your Vision Roadworthy? 2026 report
2025 campaign, 27 October–9 November; 3,778 checks across 32 British forces. Table 5 and results on pages 17–18. Self-reported eye tests and lens requirements; selected sample.
- https://www.moneysupermarket.com/car-insurance/driver-vision-report/
2,000 UK drivers aged 18+ with regular car access, surveyed 7–11 August 2026. Selected awareness and visibility findings; self-reported, multiple conditions may overlap.
- Department for Transport — guide to contributory and road safety factors
Explains police attendance, factor coverage, injury-severity adjustment and the change in recording systems.
- Department for Transport — parliamentary answer, 9 June 2026
Provides the separately referenced 2024 eyesight-factor collision count; not used to calculate a year-on-year trend.
- AOP and College of Optometrists — public support for eyesight checks
Opinium surveyed 2,000 UK adults online, 25–27 November 2025. Per-question bases and full questionnaire are not supplied. Chart labels paraphrase the release.
- GOV.UK — driving eyesight rules
Current Great Britain eyesight requirements and the practical-test eyesight procedure.
- Department for Transport — older-driver eyesight testing consultation
Closed consultation. Checked 16 November 2026; proposal distinguished from current requirements.
- The Highway Code — rules 89 to 102
Rules 92–94: number-plate distances, corrective lenses, sunlight and night-time visibility.
- GOV.UK — eye conditions and driving
Condition and licence-specific notification guidance; seek individual professional advice when uncertain.
- nidirect — driving eyesight requirements
Northern Ireland requirements and DVA guidance; separate jurisdiction from DVLA.
- HSE — driving for work: workers’ health and employer overview
Fitness to drive, eyesight requirements and reporting health concerns. Read with HSE’s employer overview of journey, driver and vehicle risks.
- NHS — visiting an optician
Routine eye-test guidance: usually every two years, or sooner if advised. This is not a universal statutory driving-test interval.
- HSE — employers: driving and riding safely for work
Scope of driving for work, including privately owned vehicles used for business, and assessment of the journey, driver and vehicle.
- GOV.UK — renew your driving licence at 70
Great Britain licence renewal at age 70 and the renewal interval thereafter; read with the eyesight and medical guidance.
Cite this guide
If you reference this guide or use its statistics, charts or analysis, please credit Online CPD Academy with a link to this page.
Suggested citation: Online CPD Academy (2026), UK driver eyesight statistics: vision checks and road safety. Evidence checked 16 November 2026.