
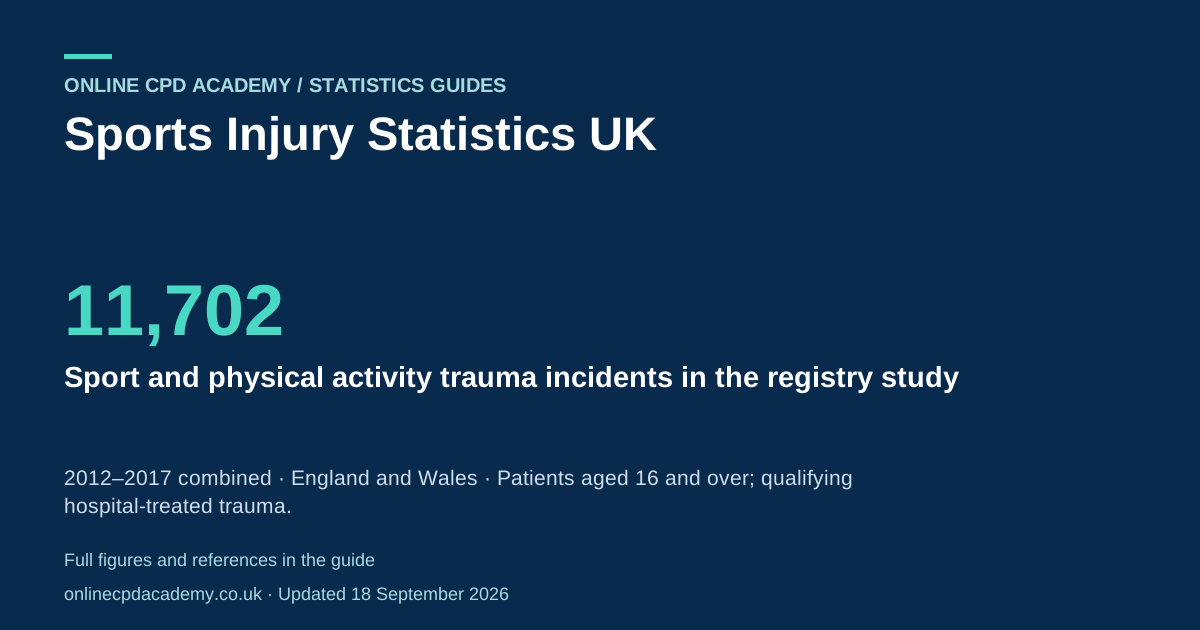
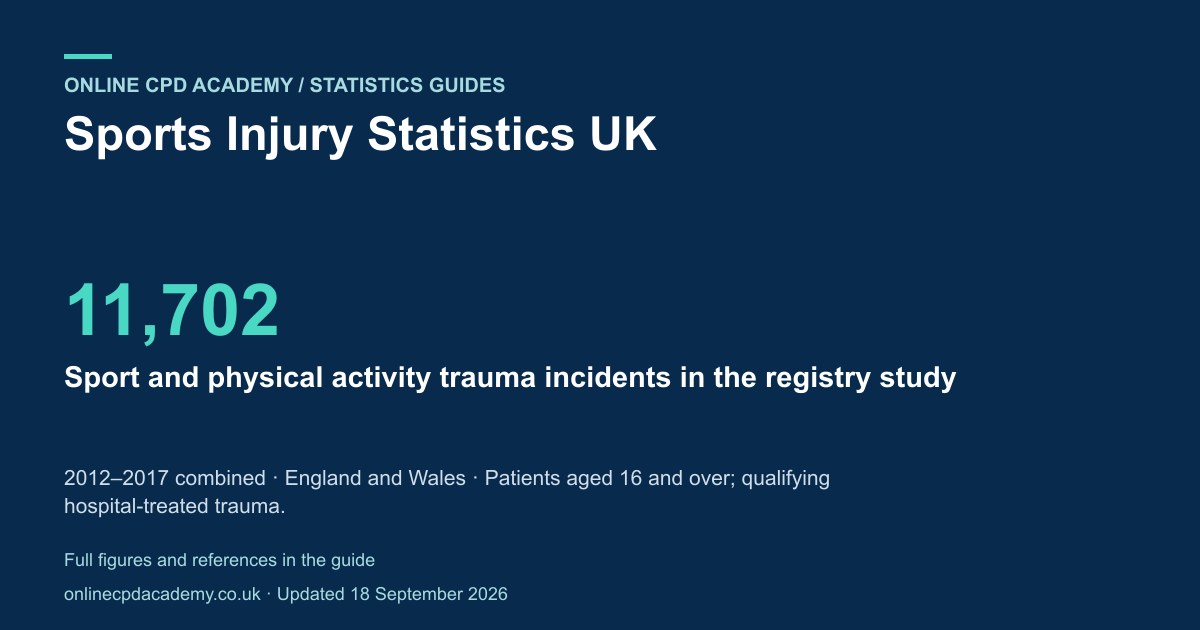
A national registry study recorded 11,702 sport and physical-activity trauma incidents among people aged 16 and over in England and Wales during 2012–2017. The estimated annual incidence was 5.40 per 100,000 participants, and 28% of cases had an Injury Severity Score above 15.
Key statistics at a glance
| Statistic | Figure | Period and coverage |
|---|---|---|
| Sport and physical activity trauma incidents in the registry study | 11,702Patients aged 16 and over; qualifying hospital-treated trauma. | 2012–2017 combined England and Wales |
| Estimated annual incidence in that study | 5.40 per 100,000 participantsParticipant-based rate, not a rate per hour of exercise. | 2012–2017 study period England and Wales |
| Study cases with Injury Severity Score above 15 | 28.0%A severity subgroup within the registry cases. | 2012–2017 combined England and Wales |
| Estimated annual incidence: sporting activities | 9.88 per 100,000 participantsHospital-treated trauma meeting the registry criteria. | 2012–2017 study England and Wales |
| Estimated annual incidence: cycling | 2.81 per 100,000 participantsUses the study’s activity and participant definitions. | 2012–2017 study England and Wales |
| Estimated annual incidence: fitness | 0.21 per 100,000 participantsHospital-treated trauma meeting the registry criteria. | 2012–2017 study England and Wales |
| Estimated annual incidence: walking | 0.03 per 100,000 participantsHospital-treated trauma meeting the registry criteria. | 2012–2017 study England and Wales |
Injury figures cover a 2012–2017 England-and-Wales trauma study published in 2023/24. UK fitness participation and 2025 water fatalities are separate contextual datasets.
How many serious sports injuries were recorded?
The national study used the Trauma Audit and Research Network alongside Active Lives participation estimates. It identified 11,702 qualifying sport and physical-activity trauma incidents across 2012–2017 among people aged 16 and over.
The estimated overall annual incidence was 5.40 per 100,000 participants. 28.0% of cases had an Injury Severity Score above 15. This evidence covers the severe end of injury, rather than routine strains, physiotherapy visits or injuries managed at home.
Injury rates by activity
The study estimated annual rates of 9.88 per 100,000 participants for sporting activities, 2.81 for cycling, 0.21 for fitness and 0.03 for walking. Motorsports, equestrian activity and gliding had the highest rates among the individual activities studied.
These are participant-based rates for qualifying trauma during the study period. A rate per participant answers a different question from injuries per visit or per hour, because the amount and intensity of participation vary.
The scale of UK fitness participation
The 2026 UK Health and Fitness Market Report covers 5,842 clubs and reports 12.2 million members over 16. UK clubs recorded 679 million visits in 2025, 10% more than in 2024.
These figures describe participation and repeat visits. They provide context for the scale of the sector, while injury surveillance measures a different outcome and population.
Water-related fatalities and recreation
WAID recorded 202 accidental water-related fatalities in the UK in 2025, within 587 water-related deaths from all causes. Within the report’s grouped activity categories, 63% involved recreation and 32% everyday activities; the activity chart excludes 31 cases in ungrouped activities.
The accidental category includes suspected natural causes and covers activities beyond sport. Some outcomes remain unresolved, and older cases have had more time for review. The figures give a wider water-safety context alongside the sport-trauma study.
What the evidence means for leisure operators
A facility’s own records can identify recurring tasks, equipment or conditions behind incidents. National evidence adds context, while a local assessment needs to consider users, exposure, equipment condition and previous incidents.
HSE recommends proportionate management of real leisure risks while preserving the benefits of activity. Swimming-pool operators need risk-based supervision and emergency arrangements suited to the particular pool and its users.
Frequently asked questions
How many serious sports injuries were recorded in the national study?
The study recorded 11,702 qualifying trauma incidents among people aged 16 and over in England and Wales across 2012–2017.
Which activities had the highest serious-injury rates?
Motorsports, equestrian activity and gliding had the highest rates among the activities in the 2012–2017 study. Its rates concern qualifying hospital-treated trauma per participant.
How many people belong to UK health and fitness clubs?
The 2026 industry report gives 12.2 million members over 16. It reports 679 million club visits during 2025, 10% above 2024.
Using these statistics?
Please credit Online CPD Academy and link to this guide when using these statistics in an article, report or website.
Suggested citation: Online CPD Academy, Sports Injury Statistics UK: Serious Injuries and Activity Rates, updated 15 October 2026.
Sources
- Davies et al. — Sport-related major trauma incidence in young people and adults in England and Wales: a national registry-based study
- ukactive — UK Health and Fitness Market Report 2026 release
- National Water Safety Forum — WAID UK 2025 Summary
- HSE — Swimming pool safety management
- HSE — Basics of health and safety in leisure activities
- HSE — Health and safety in swimming pools (HSG179)
From food hygiene and fire safety to first aid, mental health and more, we offer a wide range of accredited, online courses you can start today.
Browse all 22 accredited courses →
Mark writes about workplace health and safety, compliance and accredited online training for Online CPD Academy, the UK's leading online training company.