.svg)


%201.png)

%201.svg)


Overall incidents and incident mix
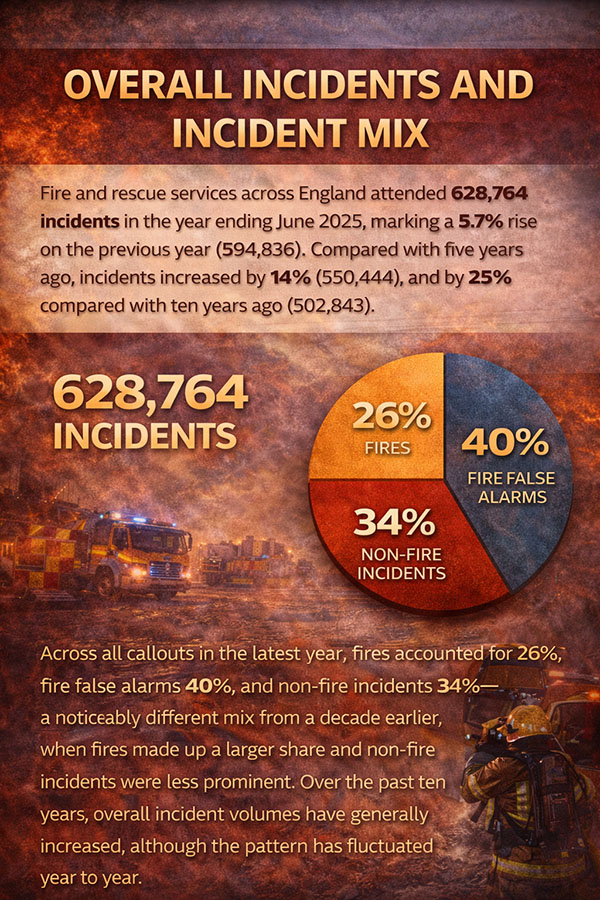
Fire and rescue services across England attended 628,764 incidents in the year ending June 2025, marking a 5.7% rise on the previous year (594,836). Compared with five years ago, incidents increased by 14% (550,444), and by 25% compared with ten years ago (502,843).
Across all callouts in the latest year, fires accounted for 26%, fire false alarms 40%, and non-fire incidents 34%—a noticeably different mix from a decade earlier, when fires made up a larger share and non-fire incidents were less prominent. Over the past ten years, overall incident volumes have generally increased, although the pattern has fluctuated year to year.
Source: FIRE0102
Total fires attended
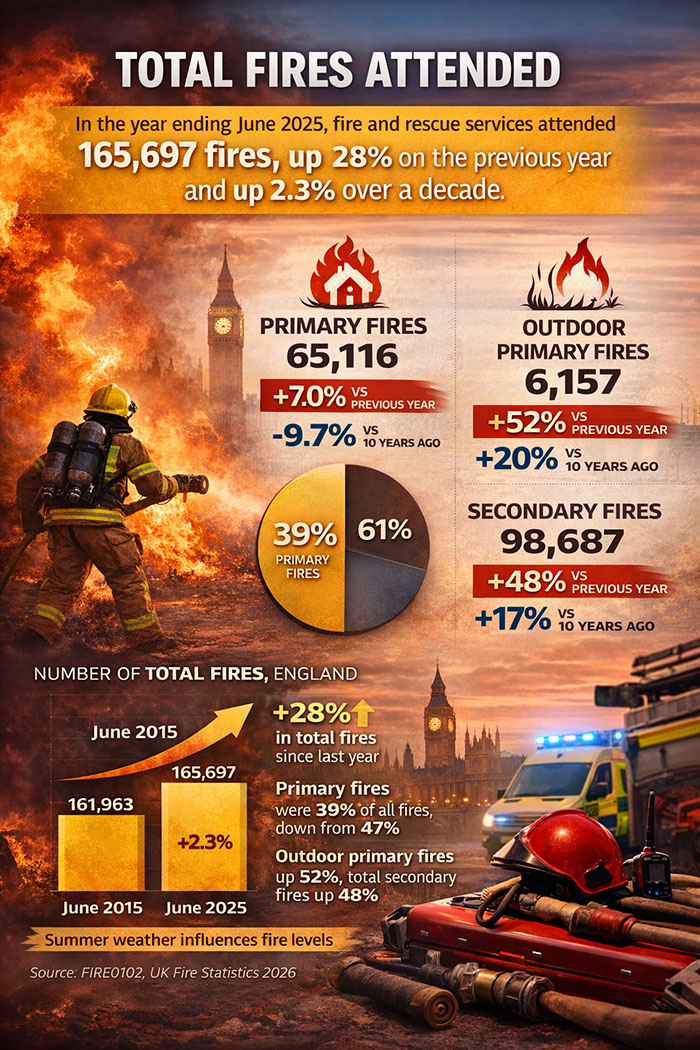
Within the year ending June 2025, fire and rescue services attended 165,697 fires, up 28% on the previous year (129,638). Over a ten-year period, total fires were 2.3% higher than in the year ending June 2015 (161,963).
Fires are categorised as primary, secondary, or chimney fires, reflecting differences in severity, location, and response requirements.
In the year ending June 2025, there were 65,116 primary fires, an increase of 7.0% compared with the previous year (60,874), but 9.7% lower than ten years ago (72,140). Primary fires accounted for 39% of all fires, down from 47% the previous year.
Outdoor fire activity rose sharply. Fire and rescue services attended 6,157 outdoor primary fires, a 52% increase compared with the previous year (4,050) and 20% higher than ten years ago (5,115). Secondary fires reached 98,687, up 48% year on year and 17% higher than a decade earlier.
Source: FIRE0102
High-rise residential fires
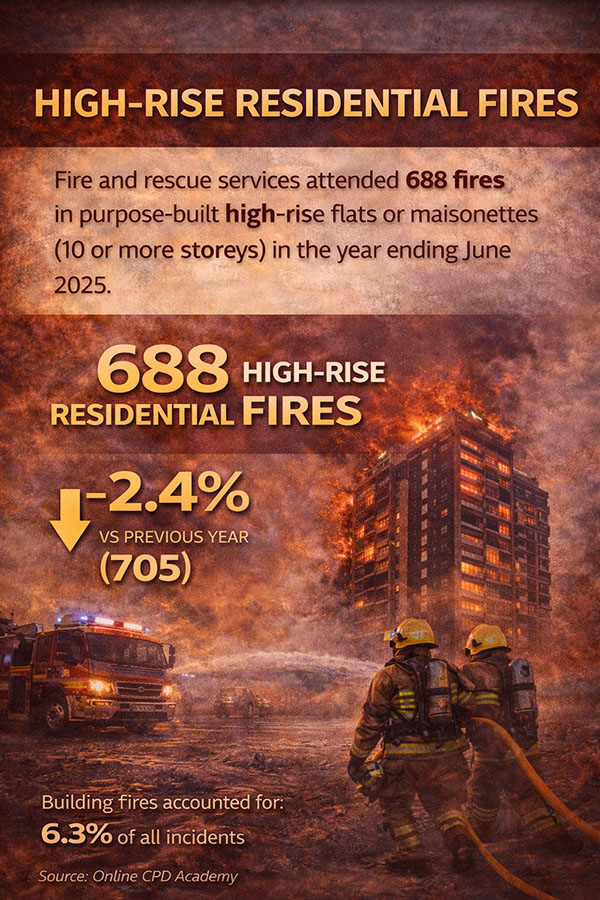
Fire and rescue services attended 688 fires in purpose-built high-rise flats or maisonettes (10 or more storeys) in the year ending June 2025. This represented a 2.4% decrease compared with the previous year (705).
Source: FIRE0205
Building fires
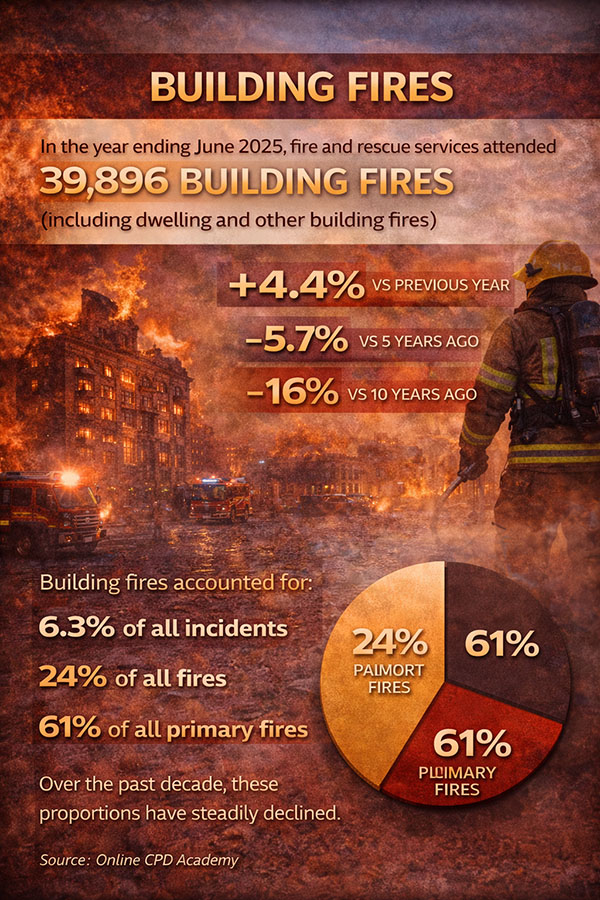
In the year ending June 2025, fire and rescue services attended 39,896 building fires (including dwelling and other building fires). This was 4.4% higher than the previous year (38,222), but 5.7% lower than five years ago and 16% lower than ten years ago.
Building fires accounted for:
- 6.3% of all incidents
- 24% of all fires
- 61% of all primary fires
Over the past decade, these proportions have steadily declined.
Source: FIRE0102
Fire false alarms
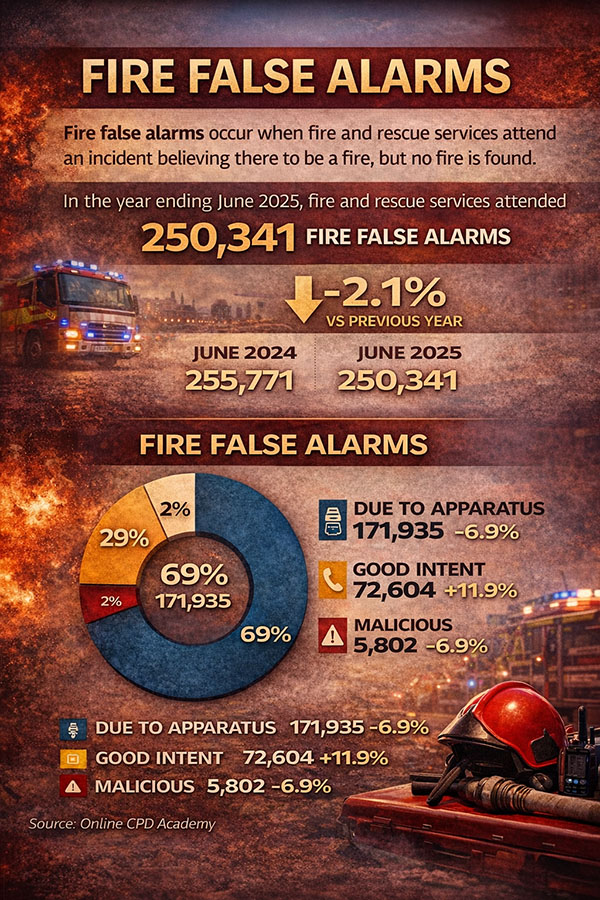
Fire false alarms occur when fire and rescue services attend an incident believing there to be a fire, but no fire is found. These are categorised as due to apparatus, good intent, or malicious.
In the year ending June 2025, fire and rescue services attended 250,341 fire false alarms. This was 2.1% lower than the previous year (255,771), but 8.1% higher than five years ago and 17% higher than ten years ago.
By type:
- 171,935 were due to apparatus
- 72,604 were good intent
- 5,802 were malicious
Non-fire incidents attended
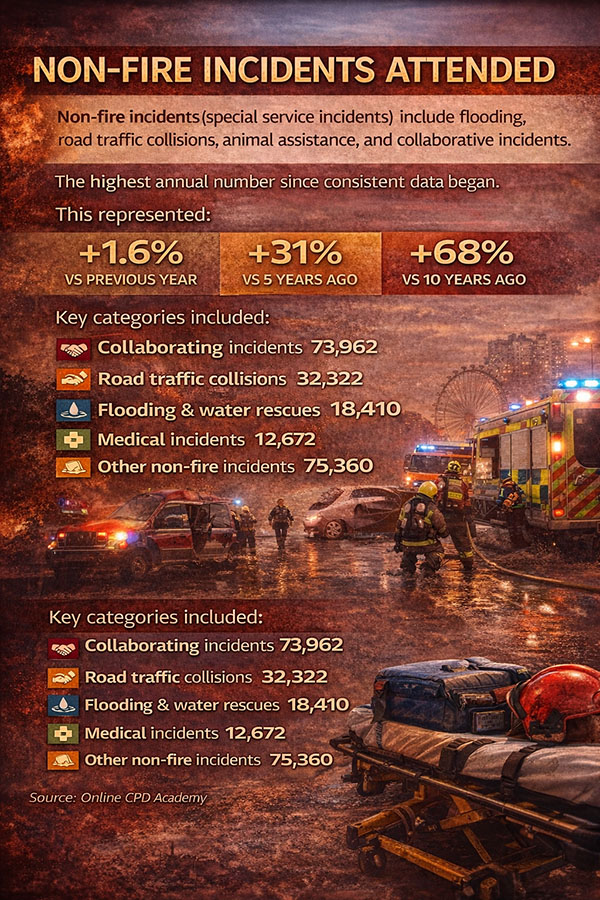
Non-fire incidents (also known as special service incidents) include flooding, road traffic collisions, animal assistance, and collaborative incidents such as assisting other agencies or effecting entry or exit.
In the year ending June 2025, fire and rescue services attended 212,726 non-fire incidents—the highest rolling-year total since consistent data became available following the introduction of the online Incident Recording System.
This represented:
- +1.6% compared with the previous year
- +31% compared with five years ago
- +68% compared with ten years ago
Key categories included:
- Collaborating incidents: 73,962
- Road traffic collisions: 32,322
- Flooding and water rescues: 18,410
- Medical incidents: 12,672
- Other non-fire incidents: 75,360
Fire-related fatalities and casualties
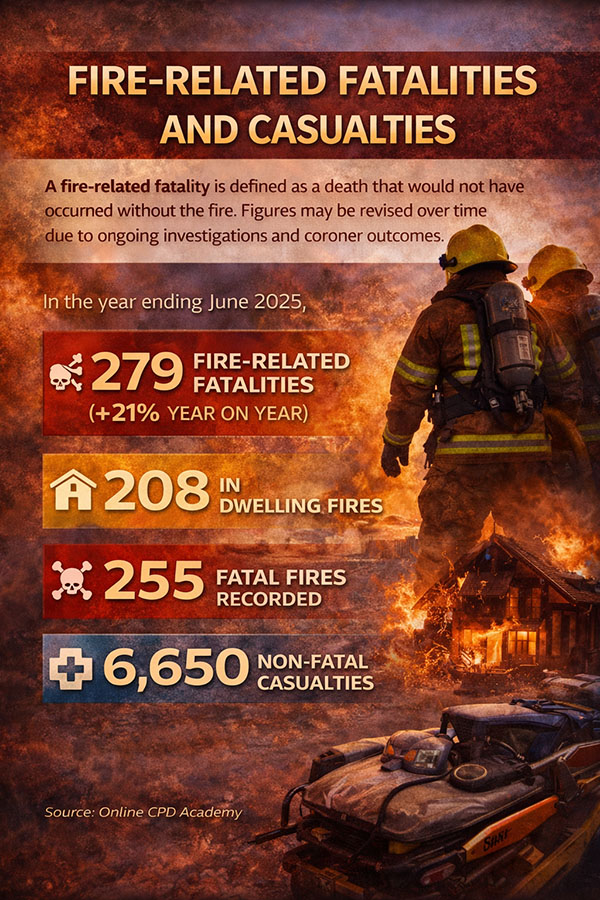
A fire-related fatality is defined as a death that would not have occurred without the fire. Figures may be revised over time due to ongoing investigations and coroner outcomes.
In the year ending June 2025:
- 279 fire-related fatalities were recorded (+21% year on year)
- 208 fatalities occurred in dwelling fires
- 255 fatal fires were recorded
- 6,650 non-fatal casualties occurred
- 2,915 casualties required hospital treatment
Source: FIRE0502
Response times to fire incidents

Response time is measured from the time of the emergency call to the arrival of the first vehicle on scene, with certain incidents excluded to prevent distortion.
In the year ending June 2025, average response times were:
- Primary fires: 9 minutes 14 seconds
- Dwelling fires: 8 minutes 10 seconds
- Other building fires: 9 minutes 5 seconds
- Other outdoor primary fires: 11 minutes 35 seconds
- Road vehicle fires: 10 minutes 14 seconds
- Secondary fires: 9 minutes 38 seconds
Response times have shown a gradual upward trend over the past decade, with a temporary reduction during the COVID-19 period.
Source: FIRE1001
Notes and data quality
This release is based on incidents recorded up to the end of June 2025, using a data snapshot taken on 15 August 2025. Because the Incident Recording System is continually updated, figures may be revised in future releases.
It should also be noted that Suffolk Fire and Rescue Service experienced technical issues, meaning some incidents between September 2024 and June 2025 were not included and will be added in future updates.
Source: Fire statistics data tables
Accredited Official Statistics Sources
Following a designation review by the Office for Statistics Regulation (OSR), the term “Accredited Official Statistics” replaced the former “National Statistics” label in September 2023. As a result, this release—previously published as National Statistics—should now be treated as Accredited Official Statistics.
Under the Statistics and Registration Service Act 2007, National Statistics is the formal legal term applied to Accredited Official Statistics that have been independently assessed by the OSR and confirmed as meeting the requirements of the Code of Practice for Statistics. This accreditation confirms that the data meets recognised standards of trustworthiness, quality, and public value.
Further information on Accredited Official Statistics is available on the OSR website: https://osr.statisticsauthority.gov.uk/accredited-official-statistics/
Rounding and terminology
Percentage figures of 10% or more have been rounded to the nearest whole number. Where percentage changes are below 0.5%, the term virtually unchanged is used.
Rolling year definition
A rolling year refers to any continuous twelve-month period made up of four consecutive quarters. This may cover:
- 1 January to 31 December
- 1 April to 31 March
- 1 July to 30 June
- 1 October to 30 September
Incident classifications
Collaborating incidents include callouts involving assisting other agencies, effecting entry or exit, and responding to suicide or attempted suicide incidents.
Medical incidents include first responder and co-responder activities carried out by fire and rescue services.
Fatality and casualty definitions
Detailed technical definitions of fire-related fatalities and non-fatal casualties are available in the official Fire statistics definitions document: https://www.gov.uk/government/publications/fire-statistics-guidance
Further breakdowns of casualty types can be found within the published fire statistics data tables.
Additional background information:
- Fire-related fatalities recorded in the year ending March 2016 can be found in the Fire statistics monitor: April 2015 to March 2016: https://www.gov.uk/government/statistics/fire-statistics-monitor-april-2015-to-march-2016
- Information on how fatalities linked to the Grenfell Tower fire are recorded is provided in the Fire statistics definitions document.
Fire categories
Primary fires are incidents that meet at least one of the following criteria: occurring in a non-derelict building, vehicle, or outdoor structure; involving a fatality, casualty, or rescue; or requiring the attendance of five or more pumping appliances.
Secondary fires are generally small outdoor fires that do not involve people or property.
About the OSR
The Office for Statistics Regulation (OSR) is the independent regulatory body of the UK Statistics Authority, responsible for ensuring that official statistics comply with the Code of Practice and serve the public good.
https://uksa.statisticsauthority.gov.uk/